

A warranty claims dashboard for China-sourced products should show which goods are exposed, which customers need a response, what service has cost and what suppliers have actually settled. Keep those views separate, then connect exceptions to an owner and a sourcing decision. A total claims card cannot tell a category director whether a batch is worse, a service team is overloaded or a factory credit is still only a request.
Show Exposure, Resolution and Recovery Separately
A useful dashboard separates affected units, service events, customer resolution, recorded cost and supplier recovery. It then links material exceptions to product and batch evidence, an owner and a defined next step for the reorder. Compare batches at the same observation age and keep money states explicit, because a younger batch or an approved credit can otherwise look better than the underlying evidence supports.
- Definition: Product exposure measures goods and time; claim handling measures cases, service events and financial transactions.
- Risk: Duplicate records, immature batches and unsettled recovery can distort supplier rankings and cost totals.
- Decision: Agree the metric definitions, build an exception queue and test the counting rules before relying on the dashboard.
Define the Warranty Promise and the Claim Record
The customer warranty promise and record definitions set the scope of a useful dashboard. Record the applicable market, product version, coverage terms, start-date rule, responsible warrantor and the evidence used to assess a claim. Keep customer handling distinct from supplier reimbursement, because an accepted customer remedy does not by itself establish a manufacturing defect or a recoverable amount under the factory agreement.
As a US example, the FTC's Businessperson's Guide to Federal Warranty Law explains consumer warranty obligations and the need for clear written coverage information. Its consumer-law scope is different from a contract between an importer and its supplier, and it is not a worldwide warranty template. Have the responsible team define the applicable obligations and promised terms for each market instead of allowing a dashboard status to decide legal eligibility.
Keep a product or unit identity, a claim identity and a service-event identity separate. Link them to the coverage version, important dates, product revision, available batch evidence, status and cost transactions; one unit may have several service events. Preserve reported, pending, accepted and rejected cases, rather than showing only accepted claims and hiding the volume still awaiting a decision.
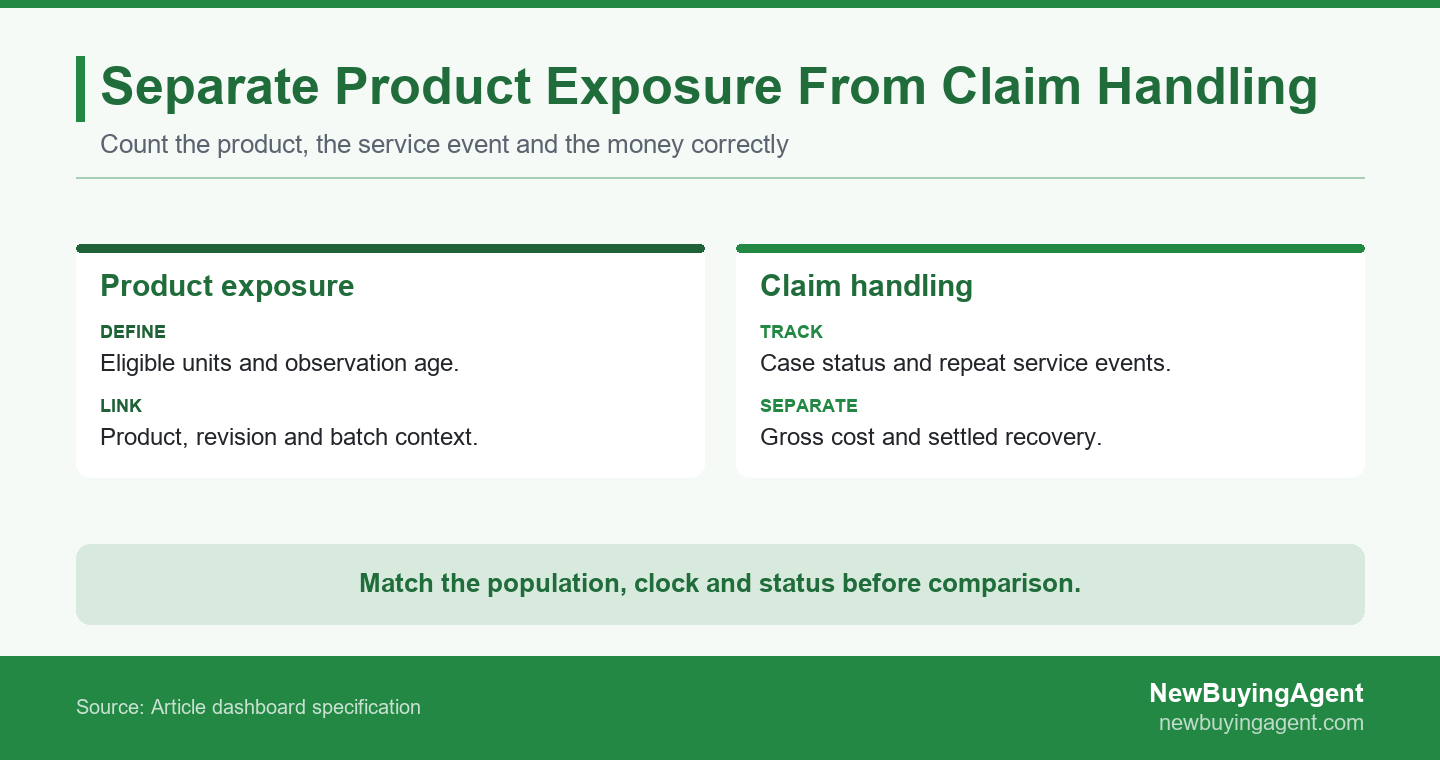
A warranty dashboard should keep affected units, service events and supplier recovery separate before comparing batches or approving reorders
Traceability must be as precise as the proposed action. GS1's retail identification guidance explains how a product identifier combined with batch, lot or serial information can provide more detailed traceability. A product reference alone does not establish which factory lot produced the item. Keep an unknown-batch category when fulfillment records cannot recover that link, and show the attribution gap before ranking sources.
Include delivery, coverage-start, reported-problem, claim-open, resolution and settlement dates where relevant. Record which dates are verified and which are estimated. If coverage starts at customer purchase rather than import receipt, an inbound shipment date is not a substitute. A case can be commercially urgent even when a coverage field is missing; route that gap for review instead of silently assigning a default date or rejecting the customer.
Give Every Metric a Population, Clock and Owner
A useful warranty metric has a defined population, clock, status and owner. A cohort is a group of units with a common delivery or coverage-start period, and its observation age must be visible when comparing claim experience. Keep those cohort measures separate from today's open-case workload and transaction-period costs, so a filter does not quietly change what the figure means.
The following specification compares seven warranty measures by counting rule, time basis and responsible owner for implementation in a spreadsheet or BI tool. Use the following counting rules as a working dictionary, then fill in the actual coverage policy, observation window, status definitions and accountable roles. Preserve the numerator and denominator in the detail view so a user can reconcile a percentage to its underlying records.
| Metric | Counting rule | Time basis | Owner |
|---|---|---|---|
| Accepted-unit rate | Distinct affected / eligible units | Same cohort age | Product/quality |
| Service events | Distinct work events | Event date | Service |
| Open cases | Unresolved case IDs | Snapshot cutoff | Service |
| Oldest case | Age from defined open date | Snapshot cutoff | Service |
| Gross cost | Deduplicated recorded spend | Cost date and scope | Finance |
| Settled recovery | Realized cash or credit | Settlement date | Commercial/finance |
| Resolution time | Closed-case duration | Closure period | Service |
Based on this comparison, the measures answer different questions and need different supporting records. More service events can indicate repeated work on the same goods rather than more affected units. A shorter resolution time among closed cases can coexist with an aging unresolved queue. Show the backlog and its age beside closure measures so the team cannot improve an apparent average simply by leaving difficult cases open.
Keep maturity visible. NIST's explanation of censoring describes reliability observations ending before every unit has failed, leaving eventual lifetimes unknown. For a warranty dashboard, the practical consequence is to compare equivalent observation ages and flag newer groups as immature. Administrative claims also depend on reporting and eligibility decisions, so this operational view is not automatically a complete failure record or a calculated survival curve.
Specify a simple layout: filters for market, product revision, source, batch, coverage version and observation period; a top row for exposure, accepted units and open workload; a middle view for matched-age batch trends; and a lower queue for actionable exceptions. Put gross cost and recovery states together in a separate financial panel. Display the refresh time, currency basis, missing-data count and any excluded records where users can see them.
Choose alert thresholds from the actual product risk, customer commitment and agreed response process. A missed deadline, repeated confirmed failure or uncertain batch attribution can require different owners. Avoid applying one universal red/amber/green claim percentage to every product family. A dashboard should expose uncertainty and overdue work as clearly as it displays a favorable rate.
Read the Dashboard Without Mixing Populations or Money
A valid dashboard comparison uses the same population and money state. The following hypothetical snapshot assumes coverage starts at delivery, remains valid through the illustrated windows and uses unique units with accepted claims. These assumptions make the calculations reproducible; actual start dates, eligibility and reporting lags still need to be checked before a real supplier or reorder decision.
In this hypothetical dashboard, Batch A has 1000 delivered units observed for 90 days and 40 unique accepted-claim units, or 4%; Batch B has 1000 units observed for 30 days and 10 such units, or 1%. At the same 30-day age, Batch A had 12 such units, or 1.2%. Unequal-age rates do not establish that Batch B is more reliable.
| Dashboard item | Batch A | Batch B |
|---|---|---|
| Eligible delivered units | 1000 | 1000 |
| Observation age | 90 days | 30 days |
| Accepted-claim units at current age | 40 | 10 |
| Accepted-claim units at 30 days | 12 | 10 |
| Accepted-unit rate at 30 days | 1.2% | 1.0% |
| Accepted-unit rate at 90 days | 4.0% | Not yet observed |
The matched-age view removes the obvious observation-window mismatch, but it still does not prove a manufacturing difference. Check product revision, use conditions, channel mix, claim decisions and reporting completeness. Do not fill Batch B's unobserved later window with zero. Keep any late-reported claim linked to its original unit group and record whether historical figures are restated.
The same hypothetical Batch A has 40 affected units and 52 service events, gross recorded cost USD 4000, supplier recovery submitted USD 1500, approved USD 900 and settled USD 600. Remaining operational cost is USD 3400 after subtracting only settled recovery. Approved and settled are overlapping statuses, not amounts to add.
Maintain separate transaction records showing what was submitted, accepted under the supplier agreement and actually settled. Cash and usable credits need a consistent valuation and currency policy. The operational calculation is a view of recorded spend and realized recovery, not an instruction for recognizing accounting provisions, receivables or reserves. Finance should define those formal reporting treatments separately.
For these hypothetical amounts, USD 600 divided by USD 1500 is a 40% settlement-to-submitted ratio, while USD 600 divided by USD 4000 is a 15% gross-cost offset. The denominators differ, and neither ratio is automatically the APQC supplier-recovery measure. Label both the time scope and the denominator rather than calling either figure simply recovery rate.
APQC's supplier recovery definition uses actual amounts recovered divided by supplier-caused warranty costs in the same 12-month reporting period. That differs from submitted claims or total gross spend when some costs have another cause. Use the definition only when its scope can be reproduced; a public benchmark or familiar metric name cannot replace the missing attribution and transaction detail.
Connect the View to Supplier and Product Decisions
A material warranty exception needs evidence, an owner, a response date and a defined purchasing consequence. The dashboard should help the team distinguish customer resolution, product investigation, supplier corrective action and commercial recovery without treating them as one status. An approved customer claim can justify service while the manufacturing cause or supplier responsibility remains under investigation, so keep those decisions linked but separate.
Maintain an exception queue with the product and batch scope, reported symptom, confirmed observation, responsible team, deadline and intended reorder effect. A repeated technical issue may need a controlled specification or process change; aging open cases may need a service response; and an unsettled approved credit may need commercial follow-up. Preserve the evidence behind the assignment and the unresolved assumptions.
Potential safety information needs its own immediate escalation path. In the US, CPSC's duty-to-report guidance describes immediate reporting obligations for specified hazards and noncompliance information. A low claim count, an incomplete supplier investigation or a favorable dashboard trend is not a reason to postpone assessment of a potentially reportable issue. Apply the actual product, market and business-role requirements.
For product-fit questions, NewBuyingAgent's AI-assisted product analysis, free Bestseller Market Analysis Report and design or style optimization can inform the next range or version choice. Use that input when evidence suggests an unsuitable customer offer rather than assuming every service case needs a factory correction. Market analysis supports selection hypotheses; it does not establish warranty liability.
For retained suppliers, NewBuyingAgent's factory management in China combines local supplier communication, production progress and quality management, staged inspections and logistics coordination. Product/QC capability can help turn a verified dashboard finding into a controlled repeat-order requirement. This sits within NewBuyingAgent's one-stop China sourcing service for global buyers, with the factory-management responsibilities agreed for the purchasing scope.
For a confirmed correction, identify the effective revision, affected purchase orders, verification method and acceptance criteria before release. Keep customer-case resolution and commercial recovery moving on their respective paths. A production change is not complete merely because a supplier replied, and a closed service ticket does not demonstrate that future goods have received the agreed change.
Test the Dashboard Before Using It for a Reorder
Verified counts and edge-case checks are prerequisites for using the dashboard to rank suppliers or approve a reorder. Reconcile its unit counts, service events, costs and recovery states to the underlying evidence, then check that filters preserve the stated definitions. A visually consistent page is not sufficient if repeat work multiplies product counts or a join repeats the same cost transaction across several records.
Microsoft's Power BI modeling guidance recommends keeping fact tables at a consistent grain, meaning a consistent level of detail. In this application, a unit, a service event and a cost transaction are different records. Keep their identities and relationships explicit whether the first implementation is a spreadsheet or a BI model, and test totals after linking them rather than assuming the join is harmless.
| Acceptance check | Test input | Expected result |
|---|---|---|
| Repeat service | Several events for one unit | Unit counted once; events retained |
| Cost links | One cost linked through several events | Cost counted once |
| Missing dates | Unknown coverage start | Gap flagged; no invented age |
| Partial recovery | Submitted, approved and settled values | States separate; no double offset |
| Reopened case | New event on an existing case | History retained; clock rule visible |
| Filters and maturity | Change market, revision or age | Correct population and immature flag |
Add a drill-through check: the category director should be able to move from a flagged measure to its contributing claims, original product reference, available batch evidence and action owner. Restrict customer personal information to the roles that need it. Agree how data corrections, deleted duplicates and late settlements are logged so the displayed history remains explainable.
Assign a data owner and a refresh schedule that fits the operating process. At each review, confirm the last successful refresh and any failed imports before interpreting a sudden improvement. Revisit the definitions when a coverage policy, product revision, service workflow or supplier contract changes. Preserve the prior definition so an administrative change is not presented as a quality gain.
To discuss China-side execution for the next order, share the reorder scope and warranty evidence with the product specification, current factory situation, quantity, destination, timing and relevant batch records. Use confirmed findings and open evidence gaps to agree a factory-management scope. The dashboard then supports a defined product and purchasing decision instead of becoming a collection of claims charts without an accountable next step.
Frequently Asked Questions
Does this dashboard require dedicated warranty software?
A warranty dashboard can start in a spreadsheet or an existing BI tool if identities, definitions, permissions and refresh controls are reliable. Begin with the required decisions and data relationships rather than a software feature list. A more specialized system may help when volumes or workflows become difficult to control, but it will still need consistent coverage rules, transaction states and ownership to produce a trustworthy result.
Should expired warranties disappear from the dashboard?
Expired coverage should not erase historical evidence. Retain the event history and apply the actual market and coverage rules to current decisions, including any continuing obligations or unresolved cases. Separate the active-coverage workload from historical product learning. Do not reset a batch's past performance by removing older units, and keep the definition of each exposure measure visible when the dashboard changes.
Is dashboard warranty cost the same as an accounting provision?
Operational dashboard cost is not automatically an accounting provision. Finance must define the recognition and estimation rules used for formal reporting, while the operational view labels the recorded spend, time scope and recovery status it actually contains. Do not treat a supplier's promised credit as cash received or use a simple claims percentage as an unqualified reserve estimate. Keep financial-reporting outputs reconciled to the approved finance process.
Should customer resolution wait for a supplier credit?
Customer handling should follow applicable obligations and promised terms while supplier recovery follows its own agreed evidence and contract path. The dashboard should assign owners and deadlines to both, with links between the cases and recovery transactions. Avoid a workflow that automatically suspends every customer remedy until the factory pays. Equally, a customer claim approval does not by itself establish the supplier's liability for all related costs.
NewBuyingAgent
関連リソース



今日始める
あなたの調達目標を現実に変えましょうWeChat:+86 15157124615
WhatsApp:+86 15157124615
住所:中国、杭州、祥園路39号10号館