
In a unit-based supplier scorecard, PPM (parts per million) is the number of nonconforming units per million units; percent defective expresses the same proportion per hundred.
Choose the counting rule and evidence scope before choosing the display unit. For an importer reviewing China production, unit-based PPM and percent defective can show exactly the same result. Neither format tells you whether the report counted individual defects, distinct affected products, inspected samples or all delivered units. That distinction determines whether the number can support a supplier review.
Start with the raw numerator and denominator, then choose the format your team or customer uses. Keep defect severity and the observation stage beside the result. This lets procurement understand what changed, quality investigate the actual problem, and the factory respond to a defined issue. A smaller-looking number is useful only when it represents a meaningful comparison.
Make the counting rule drive the supplier decision
- Choose the unit count. Distinguish nonconforming products from individual defect occurrences.
- Preserve the denominator. Show the product scope, period and number of units behind the ratio.
- Name the inspection stage. Keep factory, sample, receiving and customer findings distinguishable.
- Define the action boundary. Use the metric for follow-up while retaining a separate product-acceptance decision.
Use PPM and percentages for the same unit-based measure
Use unit-based PPM or percent defective when the question is how many observed products failed the stated requirements. NIST’s guidance on proportions defines the sample proportion nonconforming as the number of nonconforming units divided by the sample size. Count each affected unit once within that measure, even if its inspection record contains several findings. The classification still depends on the requirements and the observation scope.
With the same numerator and denominator, the conversion is straightforward: percent defective = nonconforming units / scoped units × 100; unit-based PPM = the same ratio × 1,000,000. Therefore, PPM equals the percentage multiplied by 10,000. Preserve the raw counts with either display. The conversion changes the scale of one measured proportion; it does not collect more observations or reconcile an uncertain denominator.
Use PPM when the scorecard requires it or when a percentage display would hide a small value through rounding. Use a suitably precise percentage when that is clearer to the people acting on the report. Changing the scale does not change the observed quality or evidence coverage. Avoid presenting the two formats as independent evidence that a supplier is performing well.
Order-specific product requirements come first: a handle’s dimensions, finish and fit determine what the inspection classifies as nonconforming. Use an approved drawing or sample and an agreed inspection instruction. NewBuyingAgent’s China Manufacturing and Product Guide can support earlier product research; convert that research into the actual order specification before creating a supplier score. A metric cannot settle an unresolved disagreement about what the product should be.
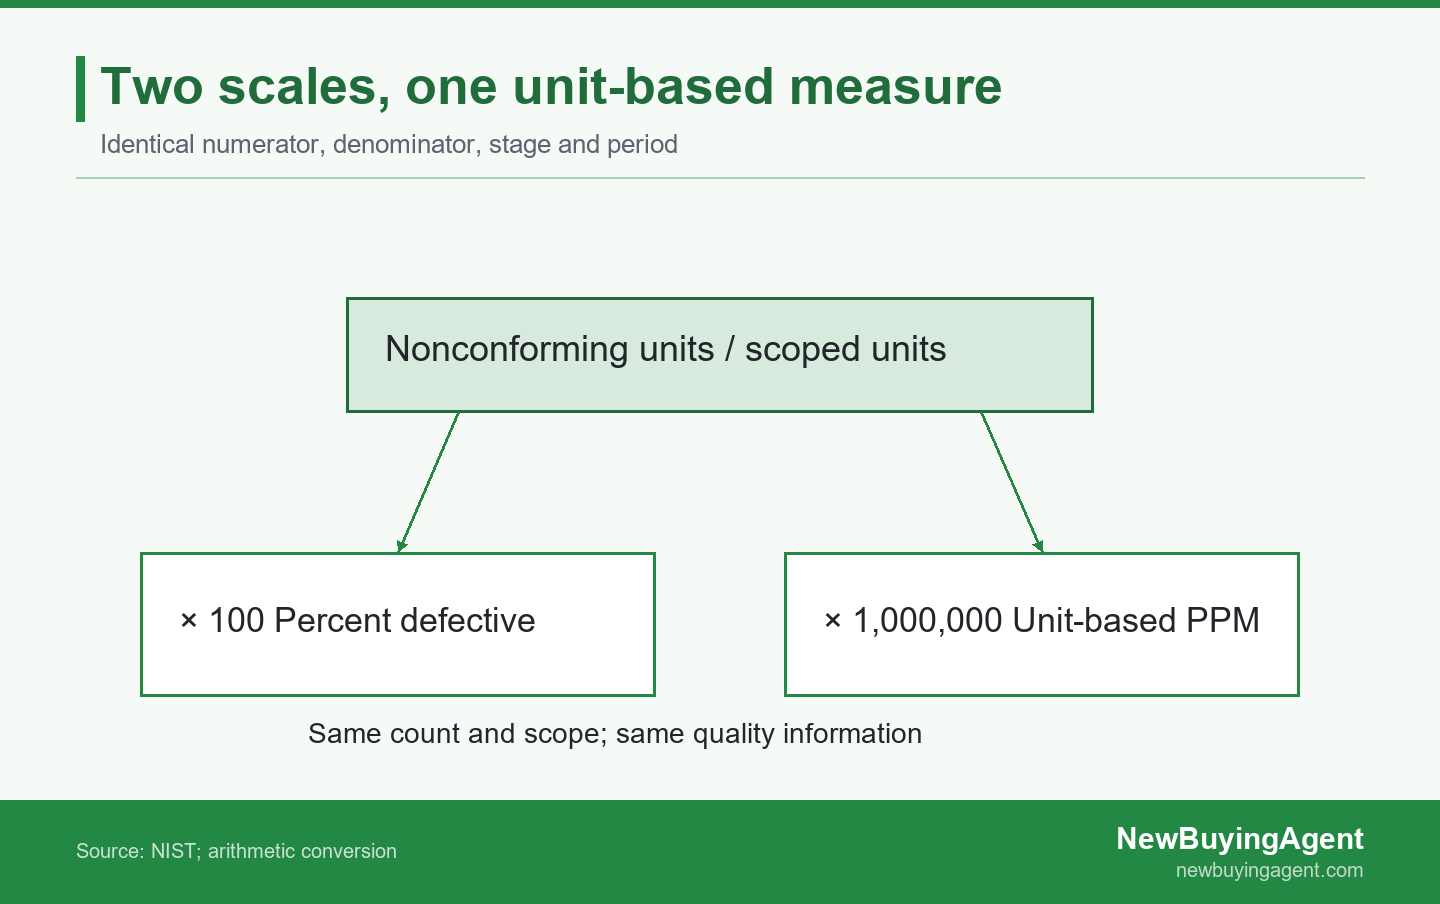
The same nonconforming-unit ratio produces percent defective or unit-based PPM without adding quality evidence.
Separate defective units from individual defects
Separate the affected-product count from the number of individual findings, because they answer different questions. NIST’s discussion of counts distinguishes individual nonconformities from nonconforming units: an item can contain several defects. For a buyer, the unit count describes how many products were classified as failing, while defect occurrences help describe the work needed to understand and address those failures. The counts need a common recording convention.
The comparison below covers four reporting forms using numerator, denominator and decision use. Only the first two express the same unit-based proportion when they use identical observations. “Defect rate” is an ambiguous label, so write the actual count basis rather than infer it from a dashboard heading.
| Reporting form | Numerator | Denominator and scale | Useful for |
|---|---|---|---|
| Unit-based PPM | Nonconforming units | Scoped units; × 1,000,000 | Affected-unit scorecard |
| Percent defective | Nonconforming units | Scoped units; × 100 | Same ratio; percent display |
| Defects per unit (DPU) | Defect occurrences | Inspected units | Defect workload |
| Defects per million opportunities (DPMO) | Defect occurrences | Defined opportunity count; × 1,000,000 | Opportunity-based analysis |
Based on this comparison, choose unit-based PPM or percent defective for affected-unit reporting. Choose DPU when defect workload matters, and DPMO only with a consistent opportunity definition. A unit can contribute more than one defect occurrence, so an occurrence-based result cannot be relabeled as the percentage of defective products. Keep the meaning visible when the same report contains both measures.
Minitab’s explanation of DPU, DPO and DPMO uses defects divided by sampled units for DPU, and defects divided by total defect opportunities, multiplied by 1,000,000, for DPMO. Defined opportunities describe the chances for the counted defects to occur. Agree which opportunities are relevant and how each is assessed before using that denominator. Otherwise, two apparently comparable DPMO results can describe different measurement systems.
Increasing the opportunity denominator can lower DPMO without changing the goods. Adding unrelated checks to a reporting catalog does not repair a loose fitting or a damaged finish. Version the opportunity definition and identify any change beside the trend. If the definition changes materially, start a clearly labeled series or recalculate a genuinely comparable baseline instead of claiming a production improvement.
Keep sample results separate from delivered-unit PPM
Keep sample-based results separate from delivered-unit performance. A sample describes the inspected units under its inspection method; a delivered-unit score needs a documented delivery denominator and an attributable nonconforming-unit count for that reporting convention. Do not divide findings from a small sample by the entire order to make its result look like an observed shipment-wide rate. The report should make the observation boundary easy to see.
If the purpose is to estimate a population proportion from a sample, account for sampling uncertainty. NIST’s guidance on confidence intervals for proportions describes methods for placing an interval around an estimated proportion. Use an appropriate statistical method and check the sampling assumptions. An interval does not repair a biased selection, an inconsistent defect definition or an inspection that could not detect the relevant problem.
Zero observed nonconforming units is not proof of zero defects in uninspected goods. Report what was inspected, how it was selected and which characteristics were checked. A targeted investigation sample can be valuable for finding a known issue, yet it should not silently become a representative supplier score. Retain that distinction when reports are combined across factories or inspection stages.
For an existing China supplier, NewBuyingAgent offers local communication, production follow-up and staged quality inspections. Buyers should agree the required report fields for the order so the evidence can answer the product question: which units were checked, against what requirement, and what was found? Its factory-management and staged-inspection service supports China-side follow-up; a supplier dashboard is useful when the underlying inspection records remain interpretable.
A supplier report can improve without the goods improving
A hypothetical drawer-handle report shows how a denominator correction changes a dashboard without establishing that production improved. The buyer first needs a defensible account of the observations, then an appropriate response to the actual product findings. Work through the record before interpreting a higher or lower number as supplier progress. In this example, the immediate correction concerns the report, while product acceptance remains a separate decision.
Reconcile the unit count before judging the result
In this hypothetical example, a retailer orders 10,000 drawer handles from a China factory. The inspector checks a sample of 500 handles. Ten distinct nonconforming handles contain sixteen recorded defect occurrences: some handles have more than one finding. The buyer can trace the observations to sample-handle references, but the dashboard does not state whether its rate concerns the sample or the entire order. Shipment approval is still unresolved.
The hypothetical report incorrectly divides 10 sampled nonconforming handles by the 10,000-unit order and displays 0.1%, or 1,000 PPM. That arithmetic combines observations from the sample with the whole order as denominator. It does not establish the proportion of nonconforming units among all delivered goods. The retailer asks for the sample tally and calculation basis before using the figure in a supplier-performance review.
Using the actual sample denominator, 10 / 500 = 2%, or 20,000 sample-based PPM. Separately, 16 / 500 = 0.032 defects per unit. The first result concerns distinct nonconforming handles; the second concerns defect occurrences. Both describe the inspected sample under the stated counting convention. Neither is an observed count for the uninspected remainder of the order.
Correct the scorecard and verify the reporting repair
The buyer corrects the sample-based report and asks the reporting owner to reconcile the defect records to unique handles. The factory and quality reviewer agree which references support the unit count and which findings belong to each handle; the original report stays available beside the corrected version. Product acceptance and any rework still require the agreed inspection evidence. The buyer does not authorize shipment from the corrected score alone, and the inspection findings continue through the order’s quality-resolution process.
After record correction, the reviewer checks the reconciled sample count, defect-occurrence total and formula against the original inspection record. The corrected display now reproduces the observations and labels their sample scope. That confirms a reporting repair, not a lower defect rate, improved goods or shipment approval. Any later claim of production improvement needs comparable observations after the relevant control change; any release decision needs its own acceptance evidence. The example therefore resolves what the dashboard means without pretending to resolve the product problem.
Compare like reporting windows before setting targets
Compare like product families, count conventions, stages and reporting windows before treating a supplier score change as improvement. A mix of easy-to-make and difficult products can change the headline even when each product’s result stays the same. Likewise, a receiving-inspection series and a later customer-return series describe different opportunities to discover problems. Keep those views distinguishable, and investigate changes in the reporting basis alongside changes in the goods.
For a pooled rate, add compatible raw nonconforming-unit counts and divide by the corresponding compatible unit totals. Do not take an unweighted average of percentages from unequal volumes. Preserve product-level and severity-level results when the aggregate could hide an important failure. If the unit counts, population coverage or observation methods are not compatible, show separate rates with their scope rather than force them into a single supplier league table.
A target is also different from a statistical signal. NIST’s discussion of control limits and specification limits distinguishes process consistency from intended product function. That distinction does not supply a universal supplier PPM target. A stable process can still produce an unacceptable result, while a contract target does not prove statistical stability. Agree the product requirements and reporting target separately, and use a suitable monitoring method when investigating process change.
For a new product brief, NewBuyingAgent combines local China factory resources with product-development and quality-control capability to supply products to agreed requirements. The buyer can carry the drawing, intended use, finish expectations and reporting convention into its product-supply service. This connects the scorecard to the product outcome being purchased. A headline PPM figure becomes more useful when the sourcing brief also explains which failures matter and how they will be assessed.
Give the scorecard an owner and a separate release decision
Give the quality scorecard traceable observations and an action owner, so the number leads to a specific follow-up. ASQ’s explanation of a check sheet describes a structured form for gathering event or defect counts. Build the metric record from those source observations, then state who reconciles the result and who responds to it. The reporting agreement should survive a handoff between the factory, quality team and procurement.
- Scope: product version, factory, order or delivery cohort, reporting period and inspection stage.
- Numerator: unique nonconforming units or individual defect occurrences; state the classification and repeat-count rule.
- Denominator: inspected units, delivered units or defined opportunities; identify the source record and coverage.
- Display: selected scale, formula, raw counts and rounding convention; label sample-based results explicitly.
- Severity: retain separate critical findings or other agreed risk categories so a low overall rate cannot hide them.
- Source evidence: inspection report, unit references, findings and attributable-event records; retain unresolved attribution separately.
- Owner and revision rules: name the reporting reviewer, action owner, review trigger and correction log; preserve changed definitions and original reports.
Keep shipment approval separate from the trend report. NIST’s acceptance sampling guidance distinguishes a lot disposition decision from estimating lot quality. A supplier trend metric does not authorize shipment or replace the agreed inspection plan. When there is an unresolved critical finding, act through the relevant product and safety process rather than let a favorable average overrule it. Record the acceptance decision with the evidence supporting that decision.
If a China order has a reporting discrepancy or recurring quality issue, share the product requirements, raw counts, relevant inspection records and current order stage. NewBuyingAgent can discuss supplier communication, production follow-up and quality-management scope aimed at the required product outcome, with an agreed evidence handoff. The buyer retains its measurement convention and acceptance authority. Request a production and quality-management discussion.
Frequently Asked Questions
Do buyers need a million units to report PPM?
No. PPM is a reporting scale, not a minimum sample size. A small observed count can be expressed per million, but the conversion does not create more evidence. Keep the raw counts beside the result, identify the inspected or delivered population, and avoid implying a level of statistical certainty that the observations do not support.
Can a PPM result exceed one million?
A unique nonconforming-unit rate cannot exceed one million PPM when its numerator is a subset of its denominator. Defect-occurrence metrics can exceed that unit-based ceiling because one unit may contain several findings. If a unit-based dashboard exceeds the ceiling, check duplicate counting, the denominator and the metric label instead of silently capping the displayed value.
What supplier PPM target is acceptable?
Set the target from the product requirements, agreement and risk, with a stated counting rule. There is no universal PPM threshold that establishes acceptability for every China import. Specify the observation stage, severity treatment and response to a breach. A commercial scorecard target also remains distinct from product specifications and any applicable safety obligation.
Can customer-return rate replace supplier PPM?
Use a separate return metric until its cohort, denominator and attribution rule are aligned. Returns may be recorded per order or per unit, discovered later, or caused by issues beyond factory nonconformity. State the reporting window and how repeat contacts are handled. Link confirmed supplier-related events back to the agreed scorecard convention without treating every return as an additional defective unit.
NewBuyingAgent
Related Resources



Get Started Today
Let's Turn Your Sourcing Goals into RealityWeChat:+86 15157124615
WhatsApp:+86 15157124615
Address:Building 10 #39 Xiangyuan Road, Hangzhou, China